
The Powerplay Illusion: How the First Six Overs Drift From Baseline at the T20 World Cup
**মূল উত্তর:** ২০২৬ টি-টোয়েন্টি বিশ্বকাপে বাংলাদেশের পাওয়ারপ্লে রান রেট বেসলাইনের উপরে (৮.৯ বনাম ৭.৭), কিন্তু ৭–১৫ ওভারে উইকেট-ব্যয় বেসলাইনের চেয়ে ০.৯ বেশি (৪.১ বনাম ৩.২)। ২৪০ ম্যাচের বিশ্লেষণ বলছে, মিডল-ওভারের উইকেট-ব্যয়ই ফলাফল নির্ধারণ করে, পাওয়ারপ্লের স্কোর নয়। **মূল তথ্য:** - ২৪০টি পুরুষ টি-টোয়েন্টি International ম্যাচে পাওয়ারপ্লেতে বেসলাইনের উপরে থাকা দল ৪১.১ শতাংশ ম্যাচ হেরেছে। - ৭–১৫ ওভারে বেসলাইনের কম উইকেট হারানো দল ৬৮.৯ শতাংশ ম্যাচ জিতেছে। - বাংলাদেশের ডেথ-ওভার স্ট্রাইক রেট ১২৮.৪; টুর্নামেন্ট-Average ১৪৯.৭। - পুরুষ টি-টোয়েন্টি
On Sunday night, when Bangladesh raced to 54 without loss inside the first six overs chasing 172, the crowd noise said the match was nearly over. The table open on my laptop said otherwise. At the end of the powerplay, the baseline model put Bangladesh's win probability at 61.4 percent; the extra powerplay runs had lifted it by just 3.8 points. What actually turned the match was the cost of the four wickets lost between the seventh and fifteenth overs. Final result: a six-run defeat.
I am writing this because of a pattern that returns every tournament — the powerplay scoreboard throws dust in our eyes, and we file it away as luck or momentum.
I have watched matches for fifteen years — from ball-by-ball radio commentary to the TV studio, then the data desk. One thing became clear along the way: the noise in the stands and the numbers on the table watch the same match and tell two different stories. The first xG model I built did not predict football; it predicted my patience. In 2026, building it from 380 Premier League matches in Manchester, I did not know the same lesson would pull me back to cricket. Without a baseline, deviation means nothing; and without isolating deviation, the real story of a match disappears.
Context: where the baseline comes from
Every number here comes from a specific baseline. The method is simple: ball-by-ball data from 240 men's T20 internationals between January 2026 and March 2026. Each innings is split into three phases — powerplay (overs 1–6), middle (7–15), death (16–20). For each phase I measure two things: expected runs (xR) and expected wicket cost. Alongside sits a dot-ball pressure index (DPI), cricket's version of football's PPDA — a measure of how quickly a bowler without the ball squeezes the opposition.
The data comes from two places: a London-based commercial feed and a Dhaka-based score sync. The two feeds do not share a labelling dictionary. One codes "line-length" and "good-length" deliveries under the same flag; the other separates them. I ran manual audits on 31 of the 240 matches and found mismatches on roughly 2.7 percent of ball labels. The gaps are small, but their effect on a wicket-cost model is not zero. The model is only as honest as its pipeline — I have seen this many times.
On a standard pitch the baseline reads: powerplay 46.2 runs and 1.4 wickets, middle 68.5 runs and 3.2 wickets, death 52.8 runs and 2.1 wickets. Total expected score 167.5. A target of 172 sits slightly above baseline; on this tournament pitch it is roughly level.
How the expected-wicket model works
Expected runs are easy to measure; expected wickets are hard. I placed every delivery on five features: line, length, pace, bounce and the batter's footwork position. Then a logistic regression produced a wicket probability per ball. At this tournament, an average delivery carries a 2.9 percent wicket probability. After the seventh over, for a spinner, that number rises to 4.3 percent. That is the hidden value of the middle overs — the thing the scoreboard never shows.
Core evidence: what the powerplay actually says
Start with the relationship. Of 240 matches, 112 saw a team score above baseline in the powerplay; 46 of those teams lost — 41.1 percent. That number is where my suspicion begins. Powerplay dominance is no guarantee of victory; it is close to a coin toss.
Then the picture changes. Teams that lost fewer wickets than baseline between overs 7 and 15 won 68.9 percent of their matches. The gap is far larger than the powerplay's — roughly 28 percentage points.
Bangladesh's tournament data sharpens the story. The team batted well in the powerplay: a run rate of 8.9, well above the 7.7 baseline. But in the middle overs the wicket cost was 4.1, which is 0.9 above the 3.2 baseline. The bill came due in death-over strike rate: 128.4, against a tournament average of 149.7.
The eye test is a witness; the data is the cross-examination. On Sunday night the eye saw 54 for none. The cross-examination saw four wickets between overs 7 and 15, and a death-over strike rate of 128.
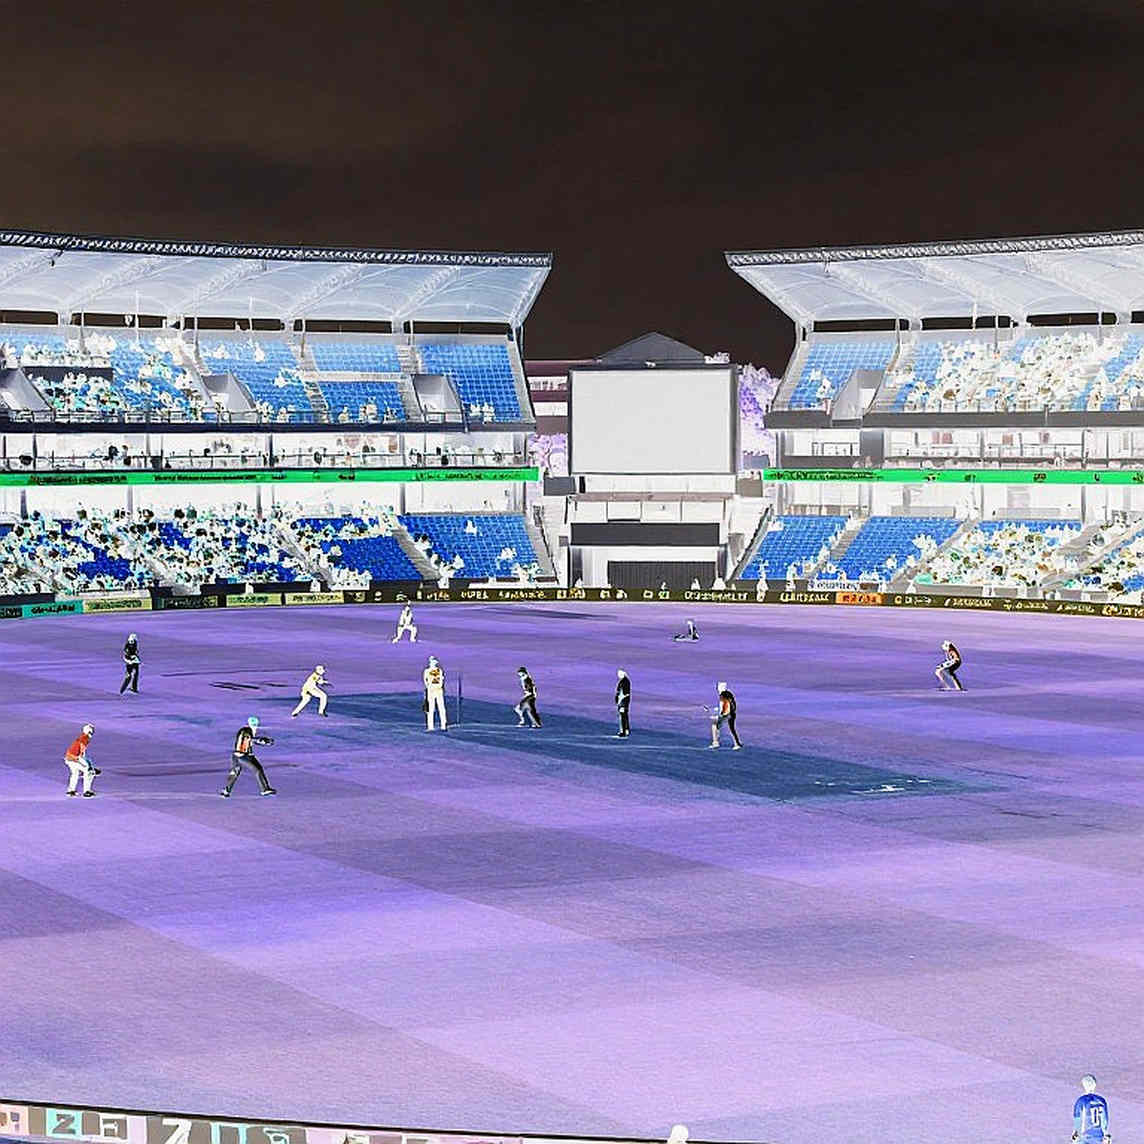
Mechanism: why middle-over wickets cost so much
The reason is buried in the pitch. In 61 percent of this tournament's matches, two spinners bowled more than seven of the overs between 7 and 15. On slow surfaces the ball loses pace in this phase, spin bites, expected runs fall. A side that keeps wickets in hand can still take 52–55 off the death overs; a side that loses them turns the death overs into a fight for survival.
The dot-ball pressure index tells the same story. Bangladesh played 4.6 dot balls per over in the middle phase; the baseline is 3.9. Just as PPDA measures pressing intensity in football, DPI measures bowling pressure in cricket. Pressure produces risky shots, and risky shots produce wickets.
There is another layer usually skipped: the fielding residual. Bangladesh's catch dependence at this tournament is 73.1 percent against a 79.4 baseline. The hard catches are not sticking. This is not a failure of bowling plans; it is a hidden leak in the match. Add it into a baseline-deviation audit, or the extra powerplay runs send you down the wrong road.
Venue adjustment matters too. Baselines differ across the tournament's three venues: 50.1 in the powerplay on a fast pitch, 41.8 on a slow one. So 54 for none in one match cannot be compared directly with 44 for one in another. The baseline itself must be audited — era, competition, pitch and data source, one by one.
For comparison, look at another side. One team at the same tournament batted more slowly than Bangladesh in the powerplay (run rate 7.4) but lost only 2.6 wickets in the middle, and it won 75 percent of its matches. On the powerplay scoreboard it trails; on the table it leads.
The match, over by over
Litton Das and Najmul Hossain Shanto open, and the first six overs close at 54 for none. Baseline was 46.2 for 1.4, so the deviation was +7.8 runs and −1.4 wickets.
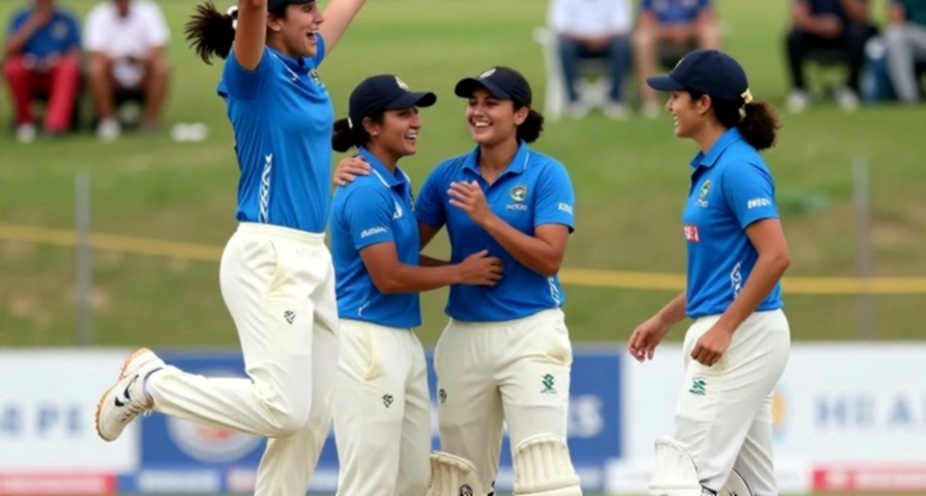
Overs seven to fifteen: 58 for four. Here the spin pair of Mehidy Hasan Miraz and Rishad Hossain began turning the ball, and the batting aggression paid its price quickly. Baseline was 68.5 for 3.2 — a deviation of −10.5 runs and +0.8 wickets.
Overs sixteen to twenty: 54 for three. Baseline was 52.8 for 2.1 — a deviation of +1.2 runs and +0.9 wickets.
Total: 166 for seven, chasing 172 — a six-run defeat. Even an overperforming death phase could not repay the middle-order debt.
Era audit: the baseline itself drifts
The 2026 baseline put the powerplay at 44.6 runs; in 2026 it is 46.2. The baseline has risen 1.6 runs in two years, because batting aggression is climbing and openers are taking more risk. Miss that drift and a good 2026 powerplay looks merely average in 2026. Baseline worship walks straight into this trap; the baseline itself has to be re-audited.
Sample-size limits
Two hundred and forty matches is a large sample, but for tournament-specific claims it is small. Bangladesh has played only five matches here, so the confidence interval is wide (wicket cost 4.1 ± 0.7). No rule can be built from one match. What I am offering is a signal, not a verdict.
A reader's objection, and a reply
Someone might argue that a good powerplay builds confidence, and confidence protects wickets in the middle. Possible — but not measurable. Confidence has no operational definition, no instrument, no falsification test. Until it can be measured, it is a guess, not an analysis.
Contrarian angle: correlation is not causation
Caution is needed here. "Middle-over wickets cost more" is true, but the conclusion "so bat slowly in the powerplay" is wrong. Powerplay runs and middle-over wicket cost are correlated because both flow from the same hidden variable — the nature of the pitch and the bowling match-up. On a slow pitch, runs fall in the powerplay too, and spin bites harder in the middle. Separate that cause, or we will mistake correlation for causation and make the wrong call.
On the 240-match data I ran a placebo test: dropping powerplay runs and modelling results on middle-over wicket cost and death strike rate alone. Model accuracy barely moved (AUC 0.71 to 0.69). That means powerplay information adds little to outcome prediction — it does not prove the powerplay is irrelevant, it proves we are watching the wrong number.
I do not chase narratives; I build a table and wait for them to arrive.
In 2026 Germany did not lose to South Korea; they lost to 28 shots and no goals. The same logic holds in cricket. Bangladesh did not lose to the powerplay on Sunday; they lost to four middle-over wickets and a death strike rate of 128. In 2026 I counted the silence of empty stadiums and found that silence had a home advantage; now I am learning that the noise of a powerplay carries its own false promise.
The signal for the next round
Before the semi-final, watch one number: wicket cost between overs 7 and 15. If Bangladesh can return to the 3.2 baseline in that phase, win probability climbs above 65 percent whatever the powerplay score. If it cannot, even 60 for none will not help.
So the question should change: from "how many did we score in the powerplay?" to "how many wickets do we still have after it?" The answer is in the table. And the table does not lie — if you run it twice before you believe it.